
Key takeaways from the report
NOI is the property's rental and other income minus operating expenses such as property taxes, insurance, payroll, repairs and management.
Cap rates are the language buyers and sellers use to price stabilized properties.
For an acquisition, the going-in cap rate is close to the investor's starting yield.
Two formulas that look almost the same
Both metrics divide net operating income (NOI) by a value:
Cap rate = NOI ÷ market value (or purchase price) ▶
Yield on cost = stabilized NOI ÷ total project cost ▶
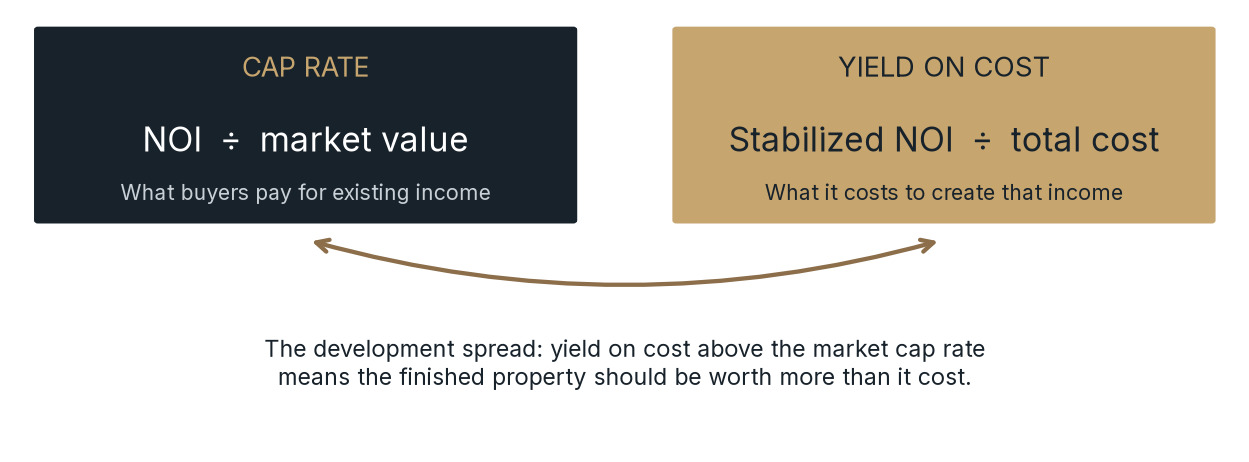
Chart Summary and Key Values
Cap rate equals NOI divided by market value; yield on cost equals stabilized NOI divided by total project cost. The chart describes the development spread: a yield on cost above the market cap rate can indicate a completed property worth more than its cost. It supplies formulas, not a guaranteed spread or investor return.
Cap rate and yield on cost compared. Concept graphic; no market data shown. Graphic: Ascendant Development.
NOI is the property's rental and other income minus operating expenses such as property taxes, insurance, payroll, repairs and management. It excludes financing costs and depreciation.
The difference is the denominator. A cap rate uses the price the market sets. Yield on cost uses the cost the developer controls.
What a cap rate tells you
Cap rates are the language buyers and sellers use to price stabilized properties. When buyers are willing to accept less income per dollar invested, cap rates are lower and values are higher. When buyers demand more income, cap rates rise and values fall. Brokers and research firms publish cap rate surveys by market and property class, and appraisers use recent trades to estimate a cap rate for a specific property.
For an acquisition, the going-in cap rate is close to the investor's starting yield. It is the price of admission to an existing income stream.
D F W TO DAY
Northmarq reports that on Dallas-Fort Worth deals closed so far in 2026, Class A cap rates have generally ranged from 4.75% to 5.0% or higher1. Cap rates differ by submarket, property age and quality, and they change over time.
What yield on cost tells you
For a development, there is no income at the start, so a cap rate cannot be calculated on day one. Instead, developers project the NOI the community will produce once it is built and leased, then divide by the full budget: land, hard costs, soft costs, financing costs, fees and reserves.
Yield on cost answers a simple question: for every dollar spent creating this property, how much stabilized income will it produce?
The spread: where development value comes from
The comparison that matters is yield on cost versus the market cap rate for comparable new properties. If a project's yield on cost is above the market cap rate, the finished property should be worth more than it cost to build, because buyers will value its income at the lower market cap rate.
Developers often call this the development spread or margin. A wider spread means:
More room to absorb cost increases or slower lease-up
More value created for owners at stabilization
Less dependence on market improvement to succeed
A narrow spread means the project relies on everything going to plan. Disciplined sponsors walk away from projects without enough spread.
H Y P OT H E T I CA L I L L U S T R AT I O N : T H E D E V E LO P M E N T S P R E A D
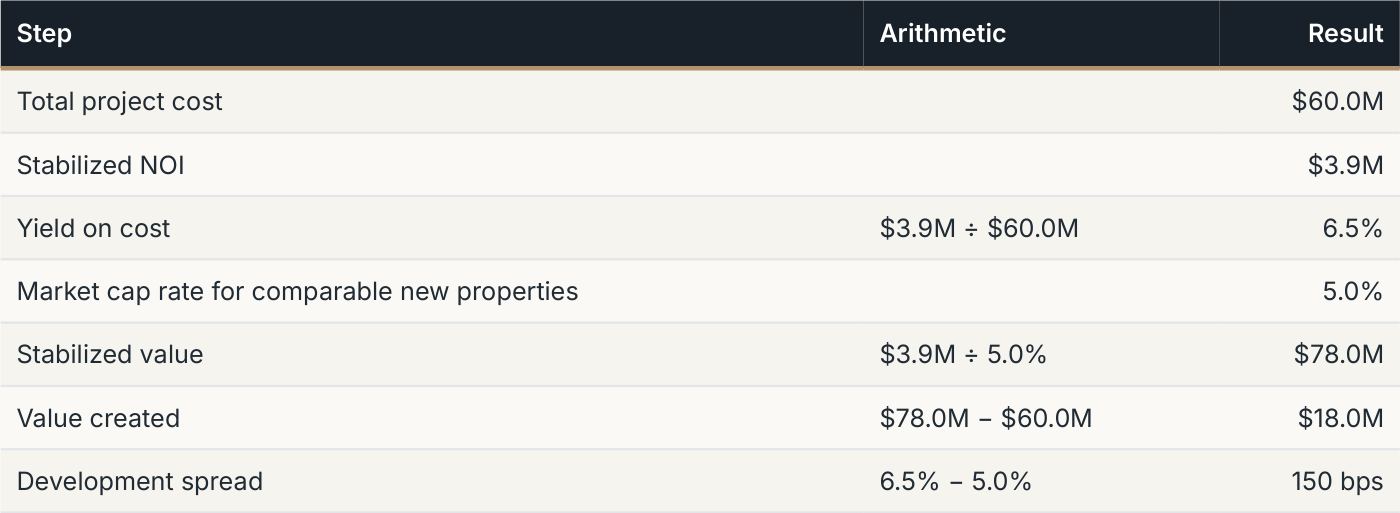
Table Summary and Key Values
| Step | Arithmetic | Result |
|---|---|---|
| Total project cost | $60.0M | |
| Stabilized NOI | $3.9M | |
| Yield on cost | $3.9M ÷ $60.0M | 6.5% |
| Market cap rate for comparable new properties | 5.0% | |
| Stabilized value | $3.9M ÷ 5.0% | $78.0M |
| Value created | $78.0M − $60.0M | $18.0M |
| Development spread | 6.5% − 5.0% | 150 bps |
Hypothetical example for illustration only. Not a projection or the terms of any offering.
What can move each number
Yield on cost can fall if:
Construction costs exceed budget
Market rents at lease-up are lower than projected
Operating expenses such as insurance or property taxes rise
Lease-up takes longer than expected
The market cap rate can rise if:
Interest rates increase
Buyer demand for multifamily softens
New supply pressures rents in the submarket
That is why careful underwriting uses current, verifiable rents, contingencies in the budget, a fully funded interest reserve, and reasonable exit cap assumptions rather than optimistic ones.
H Y P OT H E T I CA L I L L U S T R AT I O N : S E N S I T I V I T Y
The same project if costs run 10% over budget, if NOI comes in 5% lower, or if the exit cap rate is 5.5% instead of 5.0%:

Table Summary and Key Values
| Scenario | Cost | NOI | Yield on cost | Value created at 5.0% cap | Value created at 5.5% cap |
|---|---|---|---|---|---|
| Base case | $60.0M | $3.900M | 6.50% | $18.0M | $10.9M |
| Cost +10% | $66.0M | $3.900M | 5.91% | $12.0M | $4.9M |
| NOI −5% | $60.0M | $3.705M | 6.18% | $14.1M | $7.4M |
Values at a 5.5% cap: $3.9M ÷ 5.5% = $70.9M; $3.705M ÷ 5.5% = $67.4M. Value created = value − cost. Figures rounded to $0.1M.
Hypothetical example for illustration only. Not a projection or the terms of any offering.
Why this matters to passive investors
When you review a development offering, ask the sponsor to show:
1. The projected stabilized NOI and how rents were set (which comparable properties, what concessions)
2. The total project cost, including every reserve and fee
3. The resulting yield on cost
4. The exit cap rate assumption and the recent trades used to support it
5. How the spread holds up under higher costs or lower rents
A sponsor who can walk you through each step clearly is showing you how they think about risk.
Yield on cost and the supply cycle
The spread is not static. When construction starts fall, fewer new properties compete for renters a few years later, which supports lease-up rents and therefore yield on cost2.
Reading a sponsor's yield-on-cost math
When a sponsor presents yield on cost, check that the inputs are complete and consistent:
Total cost should be total. Land, hard costs, soft costs, financing costs, the interest reserve, contingency and fees all belong in the denominator. Leaving out reserves or fees makes yield on cost look higher than it is.
NOI should reflect stabilized operations. Use market rents net of normal concessions, a realistic vacancy allowance, and full operating expenses including current property tax and insurance estimates for new construction. Property taxes on a newly completed Class A community can be significantly higher than those on older properties nearby.
Rents should be supported. Ask which properties were used as comparables and how the new
community compares on location, finishes and amenities.
The cap rate comparison should be like-for-like. Compare yield on cost with cap rates for new, stabilized Class A properties in the same market, not with older properties that trade at different cap rates.
Untrended vs. trended yield on cost
Some sponsors show yield on cost using today's rents (untrended) and also using rents projected forward to when the property will actually lease (trended). Untrended figures are the more conservative test: if a project works on today's rents and today's costs, it does not depend on rent growth. Trended figures can be useful, but investors should know which version they are looking at and what growth assumption is built in.
The bottom line
Cap rates describe what the market pays for income. Yield on cost describes what it costs to create that income. Development makes sense when the second beats the first by a healthy margin, and the best sponsors protect that margin with disciplined budgets, real rent comparisons and reasonable exit assumptions.
A selection of Ascendant communities

Haven at Mansfield, Mansfield, TX · mid-rise NTX Denton, Denton, TX · garden Haven at Liberty Hills, Houston, TX · mid-rise
Join the Yield on Cost vs. Cap Rate Investor List
To talk through development investing with the Ascendant team, visit https:// www.ascendantdevco.com/invest-with-us or call Ascendant Development at 713.600.9393.
Join the Yield on Cost vs. Cap Rate Investor List
Sign up for Yield on Cost vs. Cap Rate investor updates →
Scan the code to join the Yield on Cost vs. Cap Rate Investor List.
S O U R C E S
1. Northmarq, Dallas-Fort Worth Multifamily Market Insights, Q2 2026. https://www.northmarq.com/sites/default/files/docs/
NMMarketInsights-Q22026-Dallas.pdf
2. U.S. Census Bureau, New Residential Construction (housing starts and completions). https://www.census.gov/construction/nrc/ index.html
I M P O R TA N T D I S C L O S U R E S
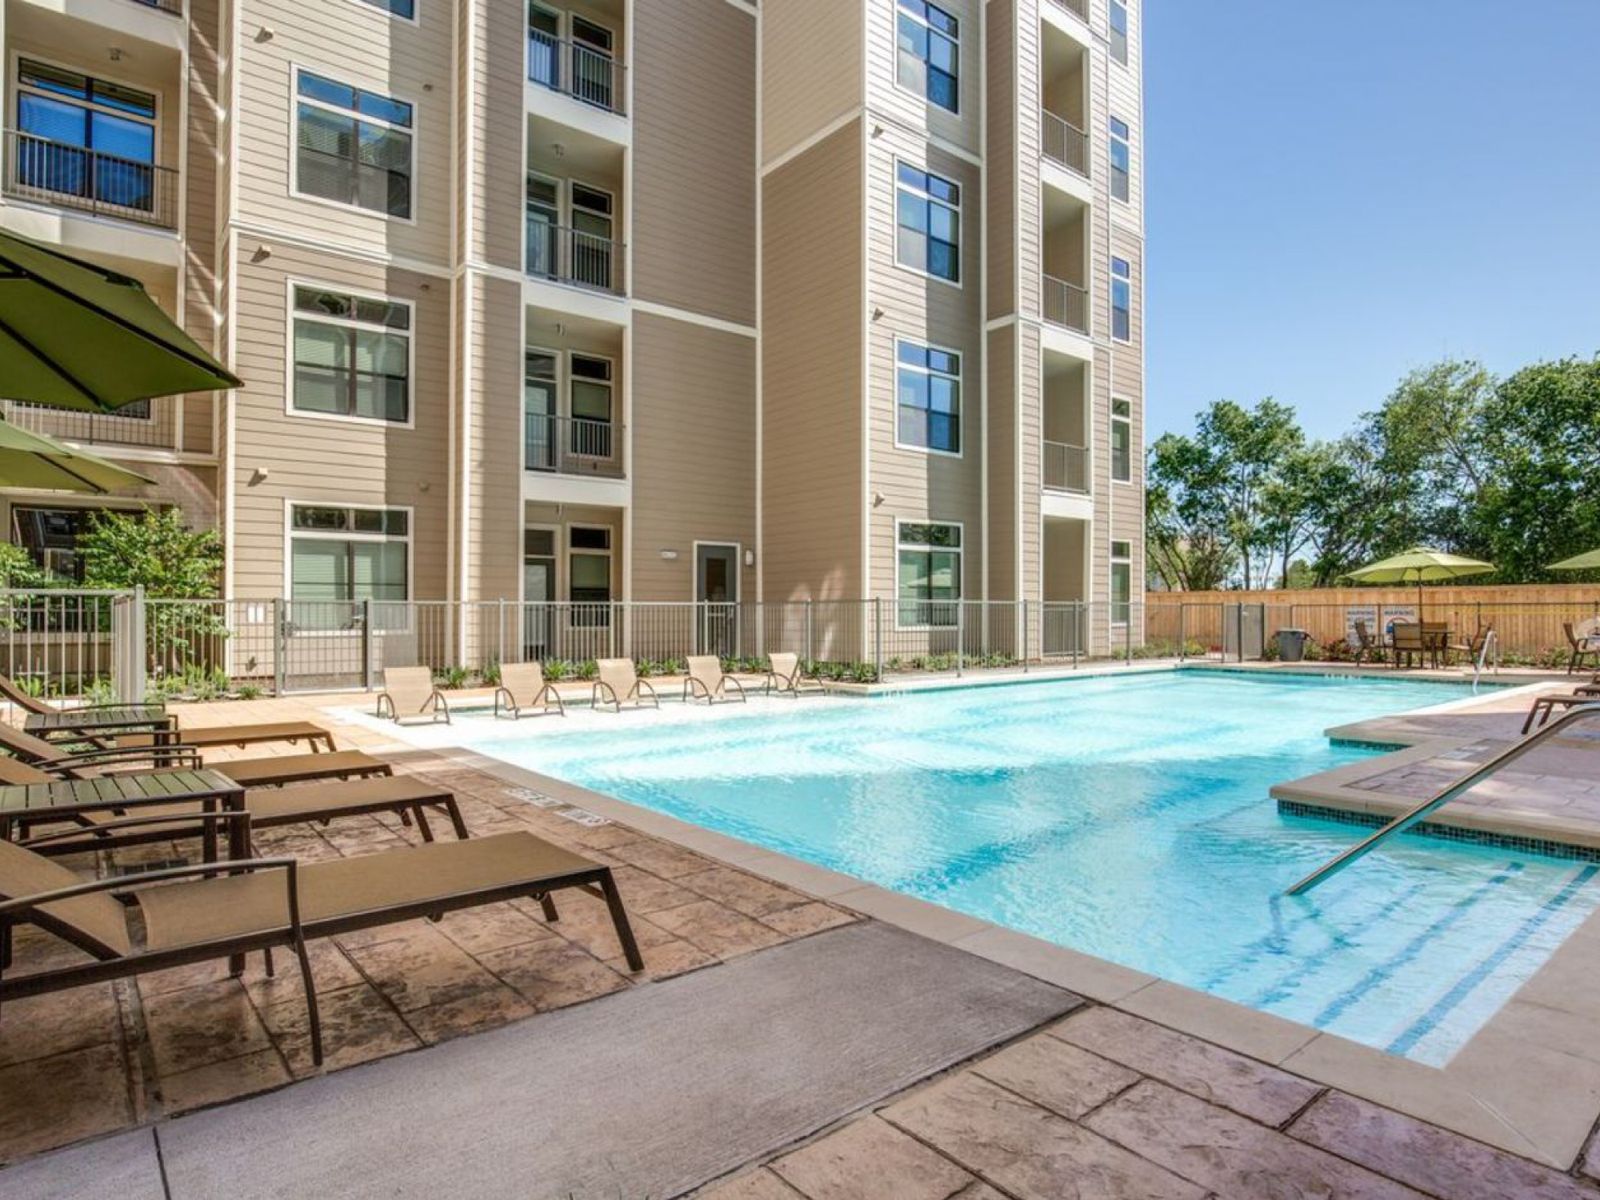
This article is for educational purposes only and is not an offer to sell or a solicitation of an offer to buy any security. Any offering by Ascendant Development or its affiliates is made only to verified accredited investors under Rule 506(c) of Regulation D through definitive offering documents, which should be read in full, including the risk factors. Real estate development involves risk, including the possible loss of principal, and is illiquid. Nothing here is tax, legal or investment advice; consult your own advisors. Forward-looking statements are not guarantees. Hypothetical examples are for illustration only and are not projections or the terms of any offering. Photographs show completed or existing Ascendant projects. They are shown to illustrate the firm's work and do not represent any specific current offering.
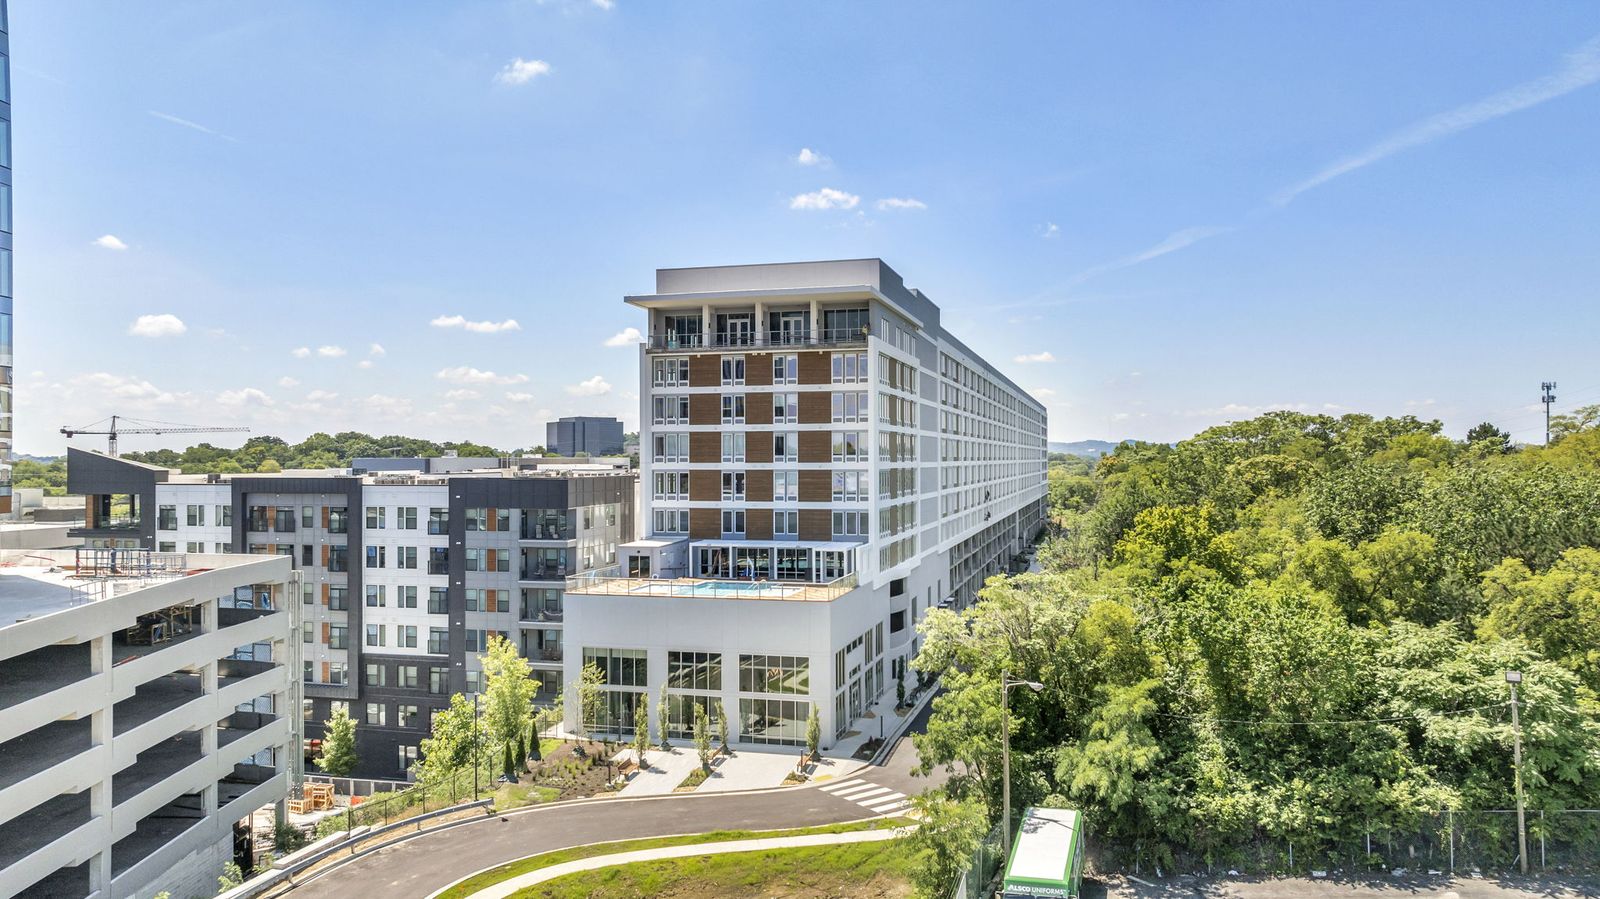
Haven at Main, Houston, Texas.
Haven at Charlotte, Nashville, Tennessee.
- Source 1 on report page 6
- Source 2 on report page 6
- Source 3 on report page 6
- Source 4 on report page 6
- Source 5 on report page 6
For educational purposes only. Not an offer to sell or a solicitation of an offer to buy any security. Any offering will be made only to verified accredited investors under Rule 506(c) of Regulation D through definitive offering documents. Past performance does not guarantee future results.